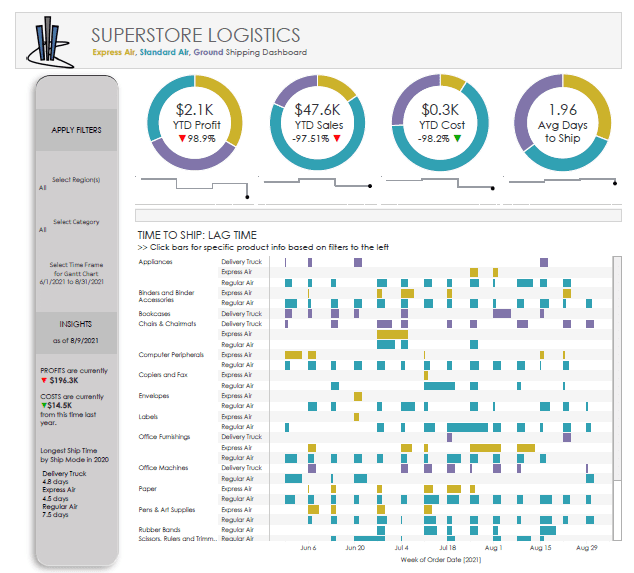
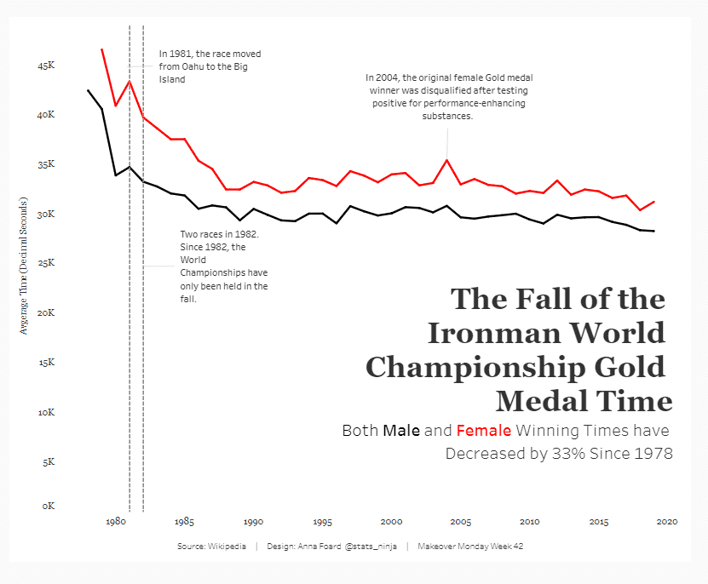
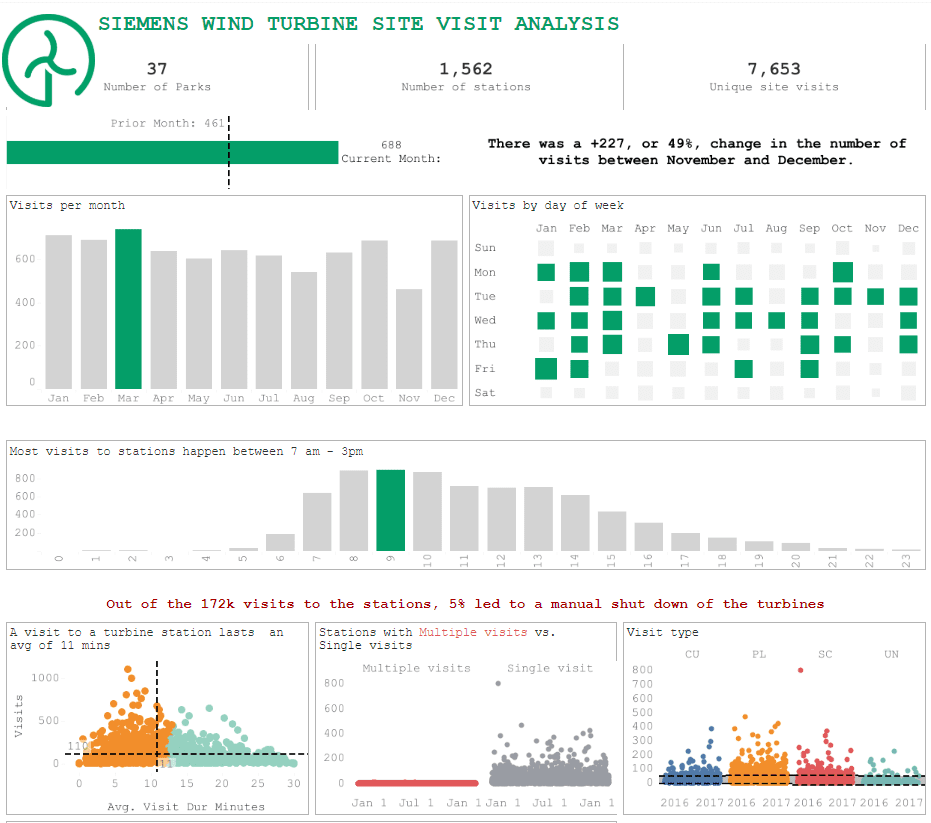
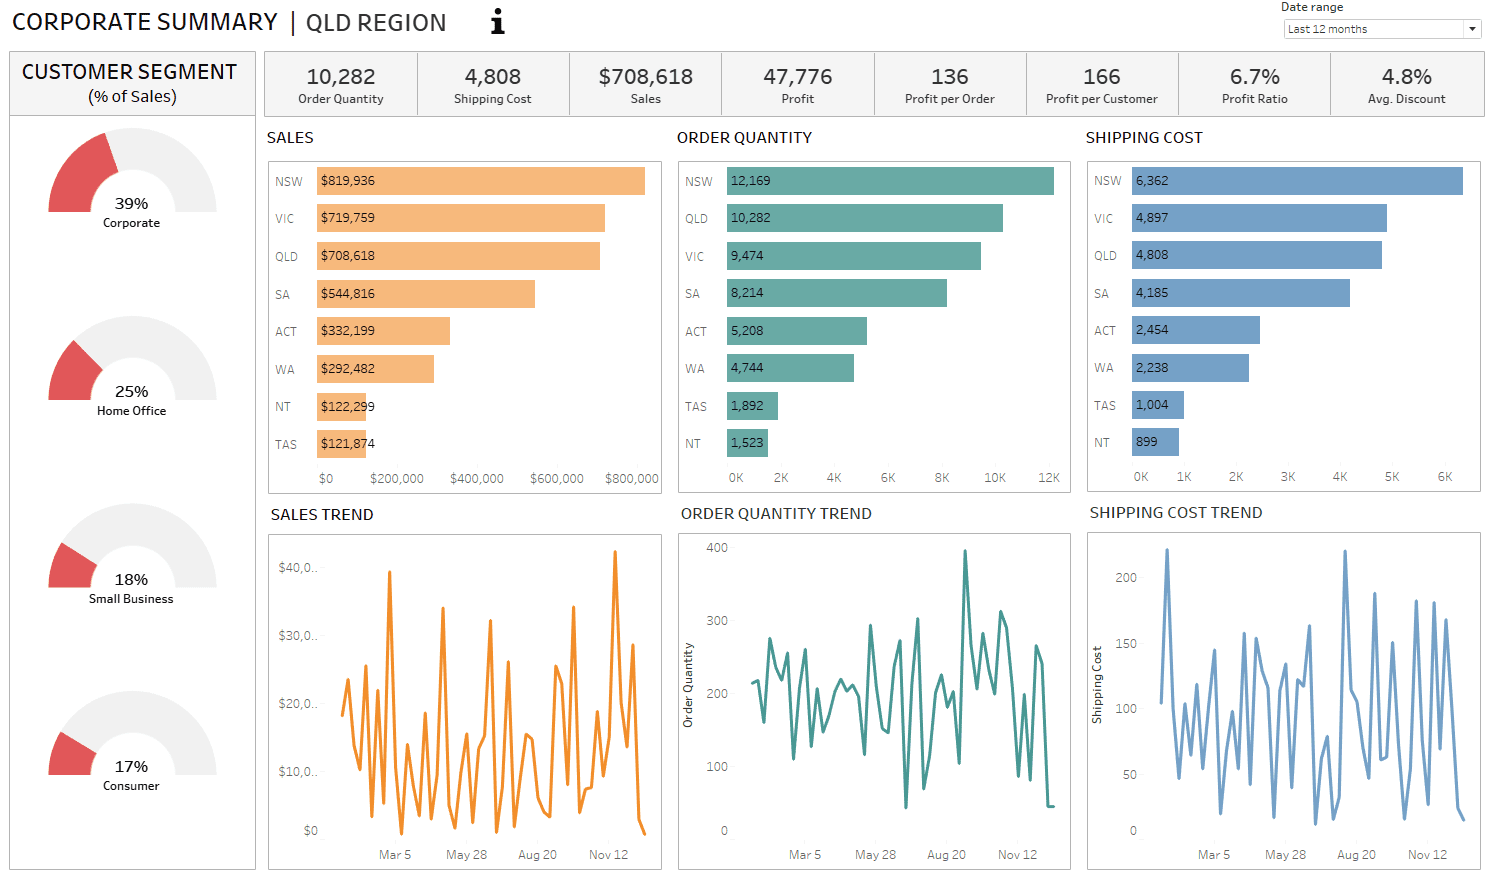
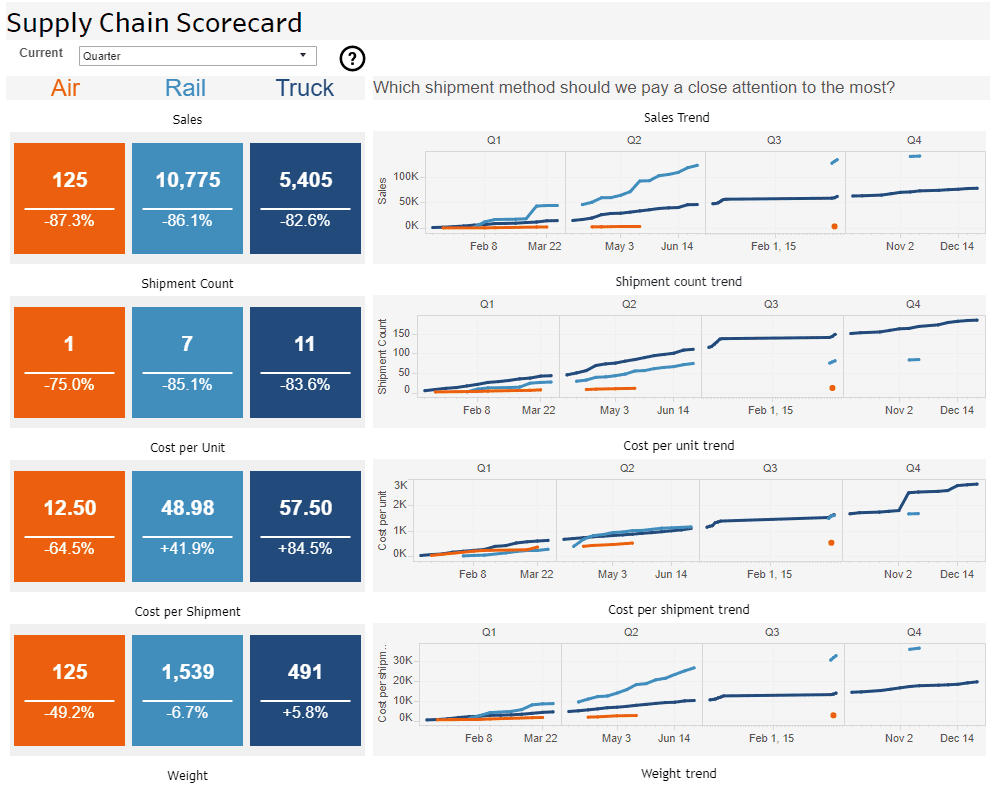
For the Tableau analyst comfortable building charts and dashboards ready to level-up their design. Learn tips and tricks for creating elegant, inviting, and user-friendly charts, infographics, and dashboards in Tableau. This course also dives into creating and importing custom shapes, color palettes, charts, and templates for seamless consistency across an organization. In this 2-day course, the last half-day will be…
Tableau
This intensive 2-day bootcamp is designed to turbocharge your Tableau skills and take your analytical ability and the insights you provide to the next level. This assumes you’re already very familiar with the Tableau interface and want to go beyond bar charts and learn a variety of advanced charts, when to use them and how they help you be a…
This is the course for you, if you want to: Understand the difference between exploratory and explanatory analysis Distinguish between data visualization and data storytelling Learn the data storytelling process Learn which charts to use to appropriately analyze data for insights Build advanced charts for immediate insights Ask the right questions to impact business decisions Determine which metrics are important…
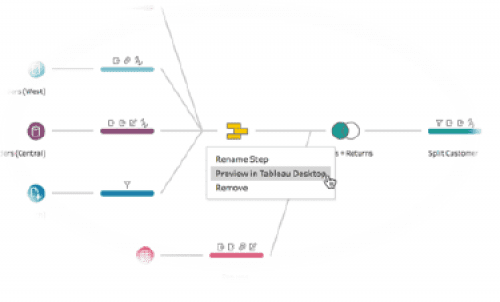
This one-day hands-on course will teach you how to use Tableau Prep, Tableau’s data preparation, data cleansing, and ETL tool. In this course, you will learn how to get your data in the right format for optimal efficiency while in Tableau itself.
This intensive 3-day bootcamp is designed to turbocharge your Tableau skills and take your analytical ability and the insights you provide to the next level.
This class is designed for someone who has moderate experience with Tableau and is ready to take basic skills to an advanced level. This class will put more tools in your analytical toolbox, such as more complex calculations, more powerful interactivity, more complex chart types, and more ways to slice and dice your data to mine for critical insights.
This is for students who are new to Tableau or who have limited experience with the software. Students will learn the fundamentals of the tool and how to use all the basic functionality to visualize their data.


